Real Time Analysis & Industrial Planning
Experiment: Applying real-time scheduling theory from embedded systems to production line planning.
Using Real Time (RT) Analysis to Compute Worker Occuption on a Production Line
When it comes to starting a new project in a manufacturing company, determining the costs to come up with a quote is important :
- Aim too high and the client will not work with you
- Aim too low and you’ll go bankrupt
To make a good quotation on large volume projects, it is essential to plan the production precisely !
You never want tobe in a situation where:
- You over-invest into machine and worforce, leading to low margins and non-comptetive prices.
- You under-estimate the work load, leading to delivery delays, production & quality problems, …
The problem is the “classic” industrial engineering theory lacks a solid base tool to model high volume production lines. Large plants often have their own model, and smaller plant often just straight up eyeball the capacity based on destimated process cycle times.
In this post, we’ll review a technique called “Real Time Scheduling”… But applied to prodctions line in order to determine the workforce occupation and costs (investements needed) linked to a production line.
“Real Time Scheduling” (or RTS) is a technique mostly used in the embedded systems field. BUT when considering processes as tasks and workforce (being a human or an operating machine) as processing units, RTS suddently becomes very relevant.
So let’s explore how RTS can be relevant for this matter and how we can build a basic production planning model based on these theories used in coimputer science…
Starting With an Example
First, let’s lay the basics: Imagine a production line with 2 machines :
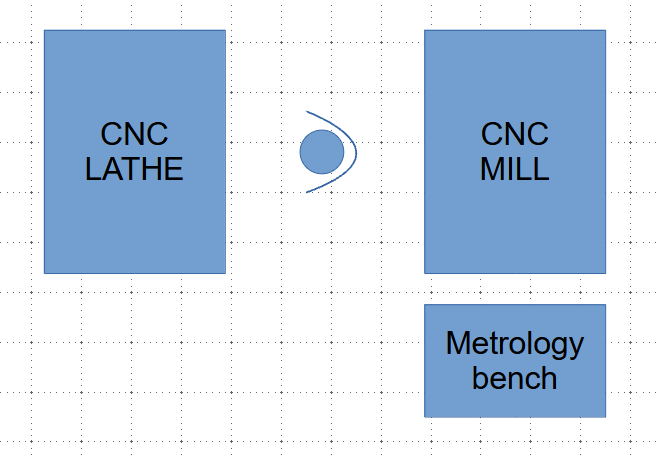
- A CNC lathe that produces 1 part every 120 seconds
- A CNC mill that produces 3 parts every 3*115 seconds (345s)
Each process in the production line here is called a “Task”. The worker shall complete these these task whilst meeting the requirements. The more tasks they are and the longer they get, the more will our worker get occupied.
The project requirements are to produce a part every 140 seconds1, so we are good on this part and the technicians did a great job. Accounting for that, we can lay our strict requirement for scheduling to :
- 1 part every 140s for the lathe
- 3 parts every
3*140=420sfor the mill
We’ll call these “Periodicity” from now on.
A these are the strict deadline we’ll have to meet everytime. This means that we have some margin to operate on the machines (load a part, clean the machines,…) :
- We have
140-120=20sof margin for the lathe - We have
420-345=75sof margin for the lathe
We’ll call these “Deadlines” from now on. This is the MAX time it will have to take for us to load a part before we cannot meet the requirements anymore, as the machninning operation is fixed-time, as well as the 140s requirement.
Let’s now record the time it takes to load the lathe and the mill :
- 15s for the lathe
- 45s for the mill
Good ! we fit our deadlines !
We’ll call these “Wort Case Execution Time (WCET)” or “Capacity” from now on. This is the time it takes to complete a task.
We now consult the metrology guys to know how much time controlling a part will take, and at what frequency we’ll have to control them, here is what they tell us :
- It takes 5mins maximum to control a part (important to get the worst case scenario !).
- We need to check 1 part every ten.
So we come up with another task :
- Perform metrology checks once every 20 parts (so once every
140*20=2800s) for 5 minutes (300s).
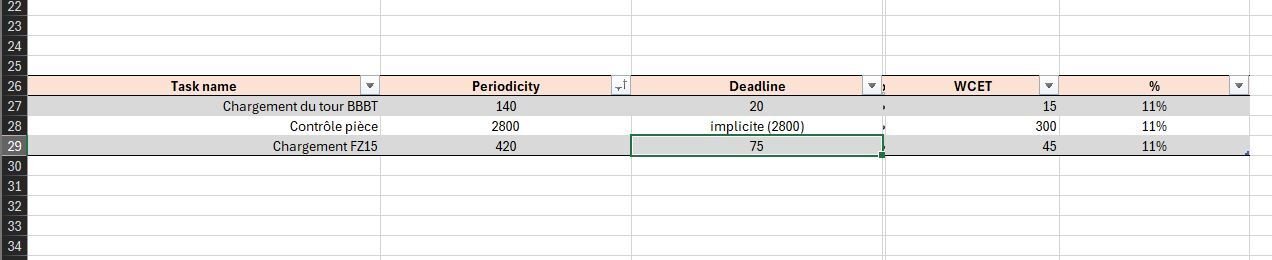
And we are done ! let’s recap all of this data in an spreadsheet.
The metrology part has no deadline as it’s just about getting 1 part done everytime.
Tasks recap
Here is a recap, I also computed the % of occupation generated by each task through WCET / Periodicity.
Quick “Hybrid” analysis to determine the occupation
So now we can already know that our operator will have ~33% of its working time dedicated to this production line by summing the occupation of each tasks.
BUT Here we have a pretty specicial system as it is a human being ! Which does not operate with 100% efficiency. Somtimes we think, sometime we get a cofee, a sip of water or go to the toilets…
To take all of this into account, the industry already developed a metric called OEE (overall equipement efficiency) and it sits at around 80-85%.
This metric is valid for a specific task but given the fact we have multiple task changes, we go for the lower bracket : 80%. Aplying this metric to our worker occupation, we get :
~33% / 0.8 = 40% real occupation.
Technically, the WCET already takes account of the OOE metric, or it may not, it heavily depends on the way we measure the timings whilst testing. I this scenario, I choose to take it into account for this broad estimate.
Determine feasability
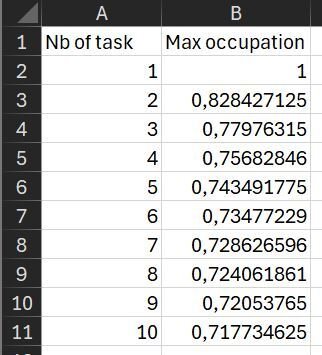
Now, we can’t really chage a system @100% and expect it to work. According to the Liu and Laylang formula, if you have more that 1 task (which is the case in most of th case), you have to use this formula to determine the upper limit of the occupation for our system to work (use light mode if you have trouble seeing it with dark background):

Or you can simply use this convinient table :
In our case :
(pseudo-code)

Real_occupation = 40%
Max_occupation = 77.9%
Real_occupation < Max_occupation

(Our production line can run !)
Simulate occupation
This simulation tool is used as an example here, its does not take into account many important things like the transition time etc… This is part of the models limits, which can be better simulated using custom made tools.
Using the cheddar simulator, we are able to simulate our operator’s journey in the production line and see how he will (more or less) operate on the production line and see if he has free & usable time to work elsewhere.
The previous calculation were estimates but here, we could add a very precise description of How many machines the worker will operate on and adding a bit of realism by adding “commute” times to each WCET.
First, let’s simulate our first scenario and see what we can do from here. (you can find a detailed tutorial on how to use chaddar here, ignore the electronics stuff by not setting it and you’ll be good to go).
POINT OF INFORMATION : In my simulation, everything is the same as in the spreadsheet, except I set the start time of the Milling to 20, as the worker will initialy strat loading the mill after loading the lathe. Also, I do not set the priority as I use a “Dealine Rate Monotonic scheduler” (Which just simulates doing whatever is the most urgent by deadline to do first, and stop whatever we did to do whatever has a shortest deadline, which lacks realism). You can do further reading on the cheddar website.
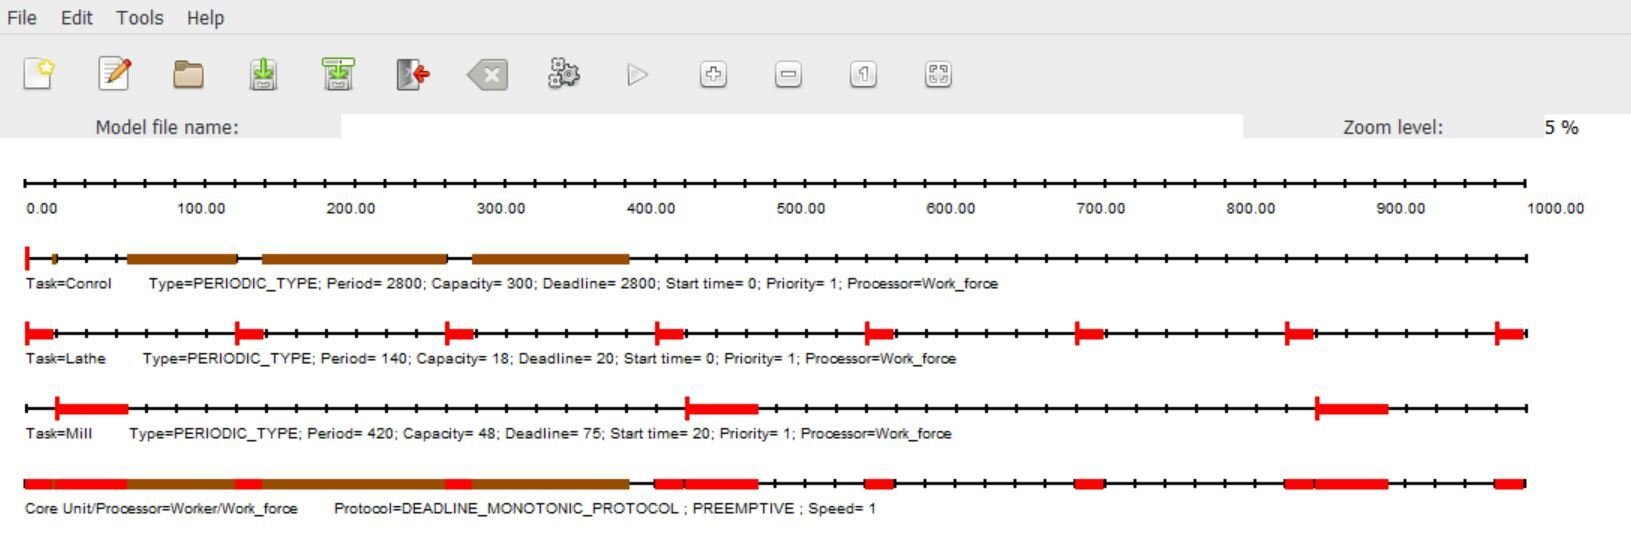
As you can see, our worker is doing great, and he even has time to spare towards the second half of this simulation !
Adding workloads on the worker
We saw that our worker will have some free time according to the simulation. Let’s consider ths new (slightly modified) scenario :
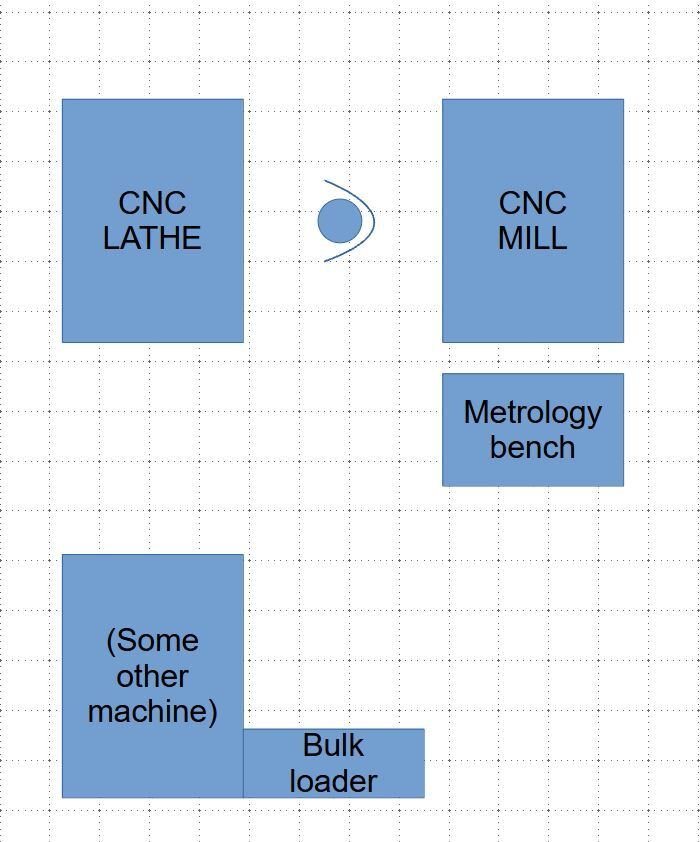
Let’s say another line needs some help to load some bulk material into machines once in a while. Instead of hiring a new employee, let’s see if our worker could handle this task :
- Load bulks into machines in an other line
- 30s WCET
- Every 10minutes (600s)
- Has to be done within 2minutes (Deadline) otherwise this other line stops by lack of bulk material to process. (120s)
Here is the new simulation result :
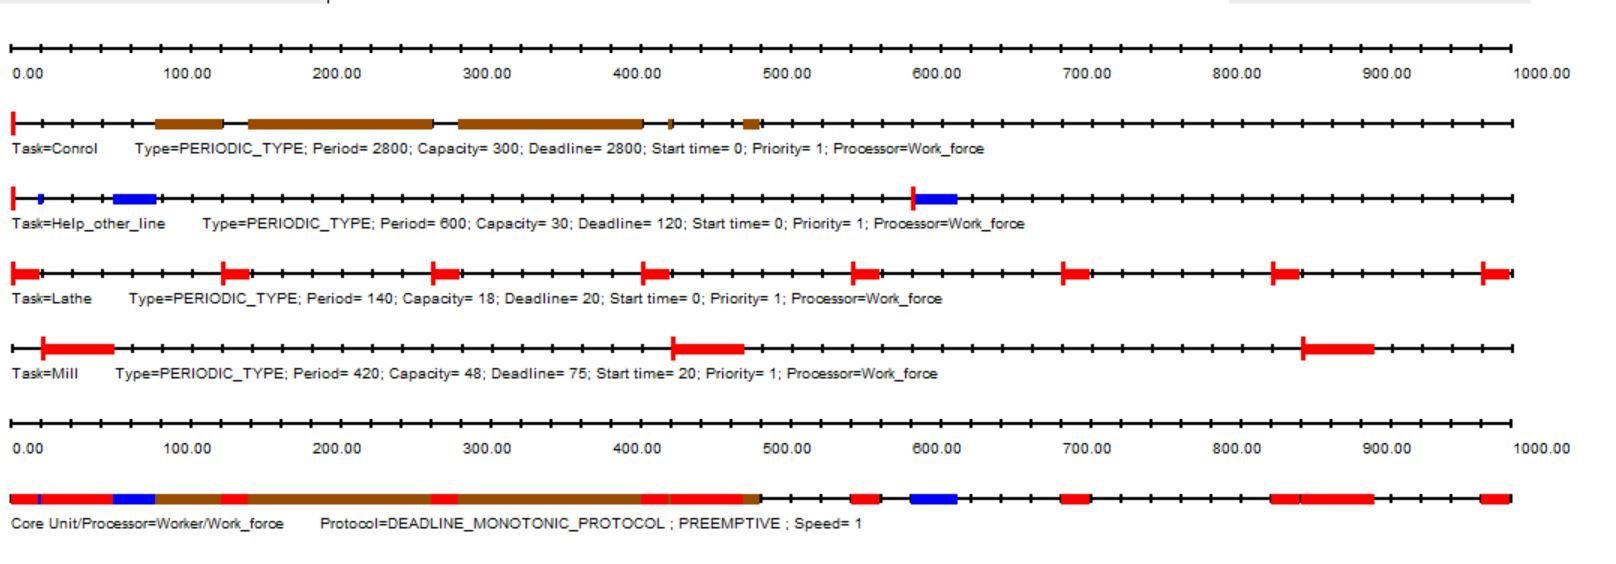
We see our worker is very busy at the beginning ! Given the facts that they are deadlines, the worker might want to dalay the “part control” task and organize himself a bit differently using the spare time he has. ut we now know it’s doable !
You can now play around with the scheduler and set priorities to the task in order to see on different organizations would affect the worker.
Limits to this Model & Improvements
Note that the example given above is just an introduction and only works for simple exmaples were pericicites and cycle times are asseted to be the same for each macine. If this approximation does not fit your use case, contect me for more infrmation on how to accurately estimate the actual line periodicity and thus : worker occupation AND real cylcle time.
We now have a very interresting tool to determine
- Our worker dedication to a production line to enhance our cost estimates and planification of the worforce.
- The number of worker we should hire.
- Whether or not our actual production rate meets orders deadlines.
Of course, beacause this tools comes from embedded system, you will have to tinker the way you model the worker differently depending on the final need.
For example, When I used this technique to plan production line IRL, I used a slightly different model where I first pick a periodicity based on the largest task and applied industry standard coefficient to take the worker’s experience and task complexity into account.
All that to say that this exmaple is very flawed. First of all, the task cannot start being completed before the machine stopped its cycle. So there is an actual delay, which exists in RTS theory models but which is not taken into account in this simple example.
Also, when planning a production line, you also have to apply coefficients to each and every action / process. These coefficients are documented in the industries based on empirical observations and most of them anre not mentionned here. This means that there is a whole pre/post provessing of the cycles times you have to perform using these coefficients.
This basic exmaple also completly lacks the representation of transition times (e.g. for someone to walk from on achine to another, tidy up tools before switching tasks, etc…). depending on what the workforce is (human/robot), the model will vary. It is up to you to take this into account using coefficient or a precise (custom) simulation tool.
Finally, depending on the industry specificities and targetted working conditions, you may manna tweak the model to fit your constraints.
At the end of the day, when I implemented this IRL, this tool was so useful, as we start from a slid proven base (RTS theory) and work our way towards a precise model to plan a very demandin production line using:
- The least amount of machines
- The least amount of worker time
- …
And this allows to business to make a precise and competitive quotation but also limit bad surprises when shit hits the fan.
Conclusion
This post was meant to introduce the reader to this tool. Similar solutions include the Cycle diagram which is kind of an old-scool forgetten tool that does not even have an english wiki version.
If you need clarifications, do not hesitate to contact me, or leave a comment below.
Thank you for reading to this point. You can write a comment below if you have any question.
Godspeed
-BRH
Calculation based on the number of parts, the number of real worked hours, etc… (Out of the scope of this post) ↩︎